Tglad
Fractal Molossus

Posts: 703

|
 |
« on: March 07, 2017, 04:21:08 AM » |
|
I have been doing a bit more investigation of fractal colour due to its shape, and looking at the 2D case. Three basic fractal curves are: 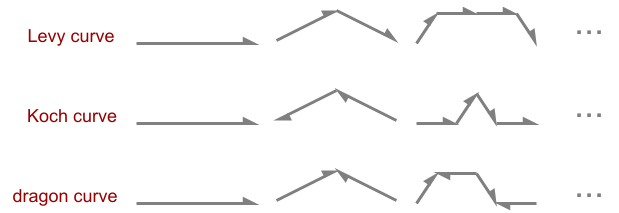 with a fourth being a version with random bend angles. The idea of the colouration is that there is some minimum resolvable spot size inside which reflected coloured light doesn't combine linearly, instead it interferes. For any given light frequency, instead of amplitudes adding, it is the complex value amplitude*e^(i * frequency * distance travelled) that sums together and you take its modulus. I look at the case where the curve is opaque, and only consider direct reflection (one bounce), so approximates low reflectivity with high light intensity to compensate. Here is a Koch curve 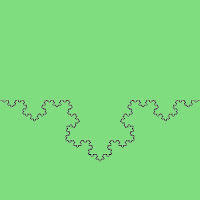 for five increasing bend angles (rows) lit front on, with increasing spot size from one pixel downwards: 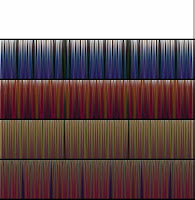 As you can see, the spot size doesn't make a great deal of difference to the colour, however the scale of the curve does. So we pick a mid-range spot size and increase the size of the curve (downwards): 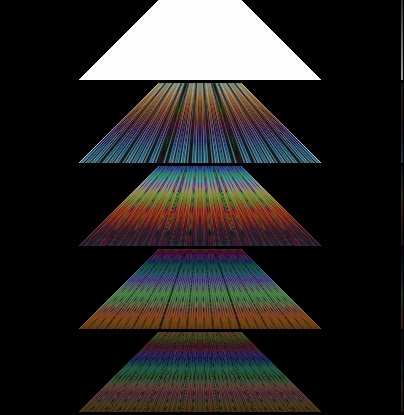 Most of this colour is because this is a single pinhole (white) light source, for ambient white light you integrate over all light directions: 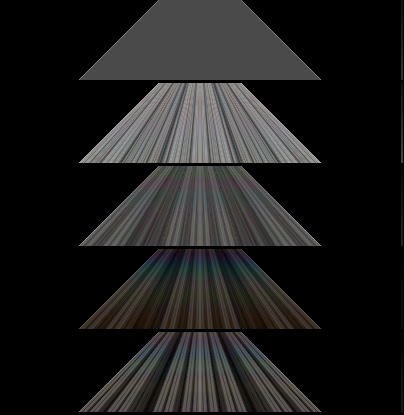 Notice it is most colourful on the fourth down (~1.4D), and gets less so as the dimension approaches 2. For the Levy curve 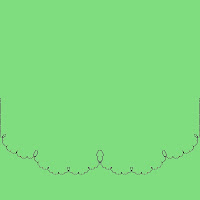 it is a bit less colourful: 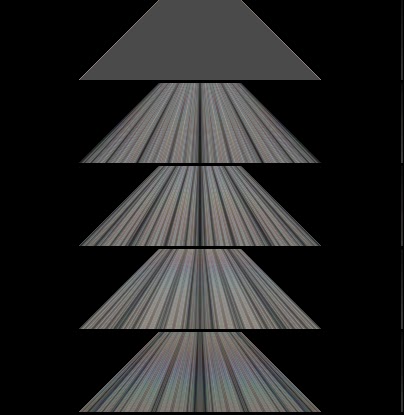 and the randomised curve has least colour: 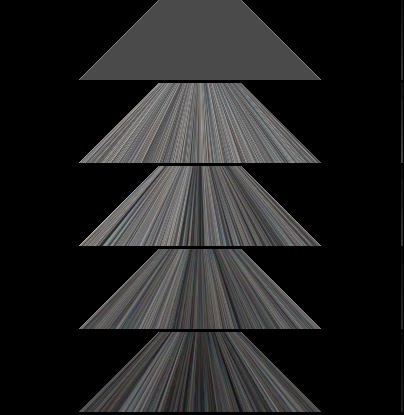 however the Dragon curve 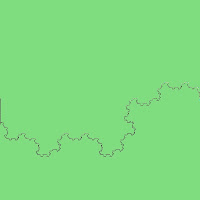 seems like the most colourful of the lot: 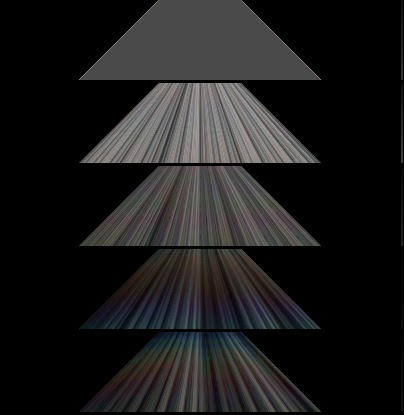 So, if I'm doing the light physics about right then I think we can say that: 1. colour is stronger when reflectivity is lower, and incident intensity should be high to compensate and due to fractal's roughness 2. colour is stronger (and shade darker) away from integer dimensions 3. colour is stronger on thinner light sources (e.g. a pinhole) and less strong on wider (e.g. ambient) light 4. colour is less strong when the curve is more random 5. hue cycles as the curve scale increases, so your fractal's colour depends on how big it is It also seems to be the case that concave parts are more red-shifted and convex parts relatively blue-shifted (or more neutral). These should all transfer to 3D fractal surfaces too I imagine. If anyone here is good with light physics, let me know if you think I'm doing something wrong!  |
|
|
|
« Last Edit: March 07, 2017, 04:33:49 AM by Tglad »
|
 Logged
|
|
|
|
Tglad
Fractal Molossus
Posts: 703
|
|
« Reply #1 on: March 10, 2017, 12:05:17 AM » |
|
And here's a rotating Koch snowflake, of increasing scale, with ambient light and a single directional light from the right:  the vertical rainbow effect seems to vary a bit as it rotates. |
|
|
|
|
Logged
|
|
|
|
Tglad
Fractal Molossus
Posts: 703
|
|
« Reply #2 on: March 12, 2017, 11:55:04 AM » |
|
If you remove the point light, so the only light is an ambient sky then a rotating Koch snowflake looks like this:  This is interesting as you can see that its colour changes with view angle, even for ambient light. I think this is correct as I have tried three methods and they all produce the same result ( http://tglad.blogspot.com.au/2017/01/the-colour-of-2d-fractals.html). So a Koch curve prism flips between brown and blue/purple every 30 degrees as you rotate it. |
|
|
|
|
Logged
|
|
|
|
youhn
Fractal Molossus
Posts: 696
Shapes only exists in our heads.
|
|
« Reply #3 on: March 12, 2017, 09:15:19 PM » |
|
Not sure if I understand all details, but this is really nice. The surface of heated metal also get color, but permanent in any direction. The color depends on the temperature. Is there any (fractal) connection? 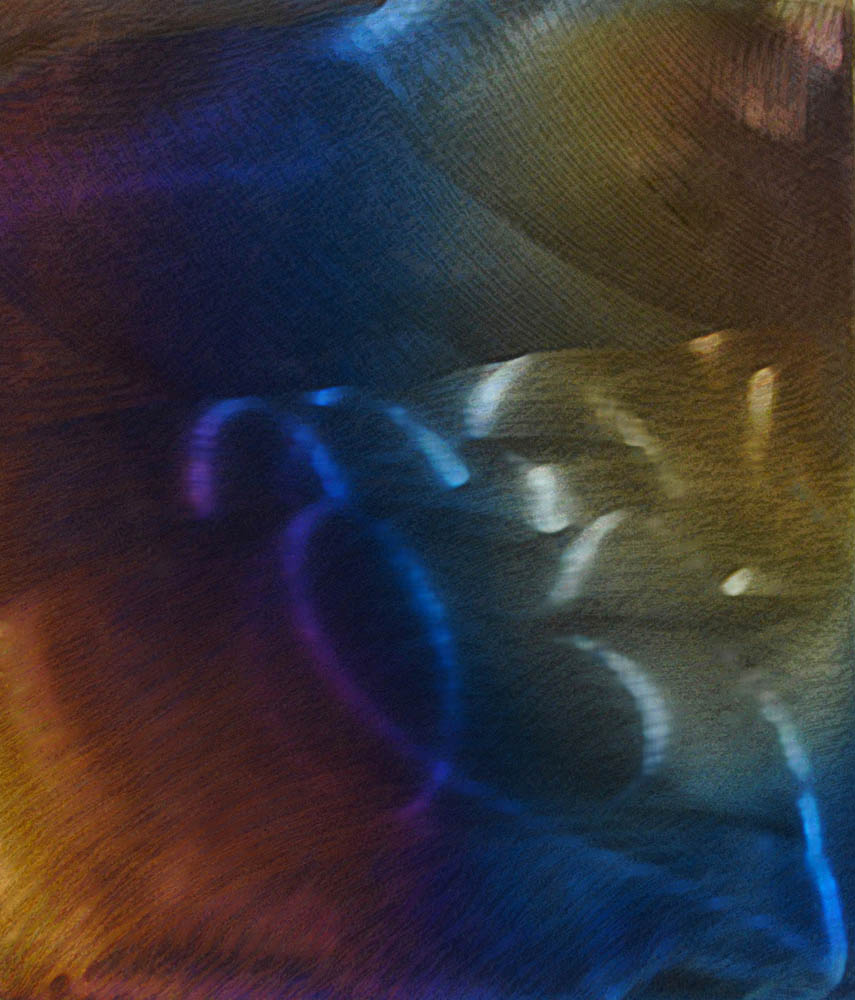 Source: https://anitachowdry.wordpress.com/2013/11/15/heat-induced-colours-on-metals/ |
|
|
|
|
Logged
|
|
|
|
|
kram1032
|
|
« Reply #4 on: March 12, 2017, 11:31:00 PM » |
|
I'm pretty sure metals that get these kinds of colors actually have their top layers react with air or surrounding molecules (sometimes high heat is necessary for reactions) and that thin film of different material is what causes this coloration. The effect is especially famously strong in Bismuth as you can see here:  In principle it's still a similar effect, but it's not quite the same. You probably know of the interference patterns you get from a double slit experiment. But do you also know what happens if you try to use white light?  This, roughly. (I think that image is computer generated though: It's quite a bit too perfectly evenly bright for a photo) If I understood what Tglad is doing right, then he's basically taking the many tiny bumps and gaps that are inherent in a given fractal (in this example: the Koch snowflake) as a sort of slit, except he doesn't really consider refraction but rather reflection, and only a single bounce deep. What you can see in the animations is basically a tapered Koch Snowflake "gear" with a scale of 1 (I think it's 1 centimeter? - relative to the wavelength of light, not relative to screen space) at the top and, it looks like about 2 (cm?) at the bottom, rotating around in two different lighting conditions (and for some reason the rotational direction also changes). Because the smaller features are on the order of the size of the wavelengths of visible light, the reflections are no longer white but actually have different brightness for different wavelengths, overally giving the gear color. |
|
|
|
|
Logged
|
|
|
|
Tglad
Fractal Molossus
Posts: 703
|
|
« Reply #5 on: March 13, 2017, 12:08:29 PM » |
|
That's exactly right, here's a diagram that might clarify: 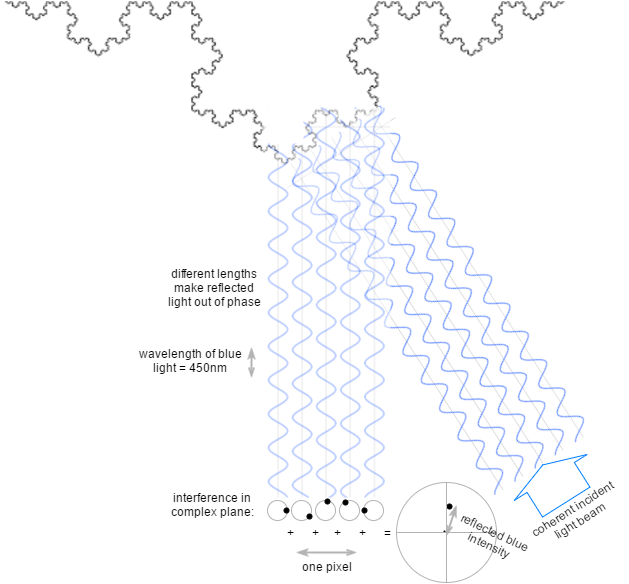 You assume each packet of incident light is a monochromatic wave of a small width (about 2 pixels), and the bumpy surface means the reflected waves have differing phase, when you add those together (thinking of the wave as circular motion in a 2d or complex plane), the magnitude of the result is the intensity for that wavelength. Do this once for the red, green and blue wavelengths, for all incidence directions and you get the fractal's colour. Assuming it is opaque, and low reflectivity (so one bounce is a good approximation). I made each pixel about 4 wavelengths wide, so about 2 microns wide, so the "gear" image is about 0.6mm wide, however the colours remain the same for enlargements by any powers of three due to symmetry, and in-between scales just have a vertical shift of the colours. I think the technique is valid, it is based on this awesome page: http://www.itp.uni-hannover.de/~zawischa/ITP/diffraction.htmlThe interfering beam width maybe justified since: Light coming from one point will shine on an approximately circular area on the retina (or film/sensor), and correspondingly all rays arriving at one point of the retina will originate from a small, circular area |
|
|
|
|
Logged
|
|
|
|
claude
Fractal Bachius
Posts: 563
|
|
« Reply #6 on: March 13, 2017, 12:48:20 PM » |
|
Do this once for the red, green and blue wavelengths, for all incidence directions and you get the fractal's colour.
Better would be to use CIE XYZ colour space to accumulate monochromatic light over a spectrum with more granularity than just 3 sample points - otherwise you might miss some important peaks/troughs. |
|
|
|
|
Logged
|
|
|
|
|
kram1032
|
|
« Reply #7 on: March 13, 2017, 01:27:51 PM » |
|
Do you think you could expand it to include more bounces and/or more possibly color-giving effects? There might actually be some iterative or recursive procedure to find arbitrary light paths through the Koch snowflake to arbitrary depth due to its high symmetry. Equivalently, if you try the random version, you probably could even emulate infinite depth via some monte-carlo random walk of the light source near the boundary.
And how do you sample the white light? Do you just pick a handful of channels and convert them over to RGB? I think you could "properly" sample a blackbody white light source to get a full spectral view. Sampling from the correct distribution would be really easy. The hard part simply would be to correctly transform the result to RGB. But since you did some fancy more-than-three-color math already, I can only assume you have something ready that should scale to arbitrarily many input channels.
|
|
|
|
|
Logged
|
|
|
|
|
kram1032
|
|
« Reply #8 on: March 13, 2017, 01:31:03 PM » |
|
For color management, you could try supporting OpenColorIO and using Filmic Blender which is a special OCIO file that really expands on the dynamic range you can use in your images. This might mean a lot finer details for dark and bright spots. - Filmic Blender apparently is based on the industry standard used by Hollywood to really get the most out of your image details. |
|
|
|
|
Logged
|
|
|
|
Tglad
Fractal Molossus
Posts: 703
|
|
« Reply #9 on: March 15, 2017, 11:33:34 AM » |
|
Good point Claude, I was just looking at the red, green and blue wavelengths. Converting a higher res spectrum into RGB is a bit tricky, I have just tried using the answer 6 here: http://stackoverflow.com/questions/1472514/convert-light-frequency-to-rgb and I get this:  the main difference to the previous gif is that the aqua part is less noticeable. The brown part is perhaps less strong but that's because the average rgb (if I integrate over all the visible frequencies) is a little bit purple:  I was unsure whether white light should be equal intensity for equally spaced frequencies, or equally spaced wavelengths, but the latter gives a really orange colour so I used the former. Is this where the blackbody white light source that kram talked about comes in? [Edit: in hindsight, I am somehow using these light sensitivity curves incorrectly, instead I have used a simple intermediate colours (yellow, cyan) to get 7 samples instead of 3, this is about enough as the spectrum isn't that spikey]. "Do you think you could expand it to include more bounces" possibly, but it gets quite expensive, its already a multiple integral over spot size, fractal length, frequency, incident angle and time. ".. and/or more possibly color-giving effects?" The other effect would be from refraction and total internal reflection... it would need a chosen refraction index... I haven't looked at this, but it has been suggested that this can give stonger colouration. The strongest colours come from point coherent light sources of just a few frequencies (e.g. red, green and blue), like so (with just a little ambient light):  "you could try supporting OpenColorIO" Yes the high dynamic range sounds like a better way to store these colour experiments, rather than the 0 to 255 gifs. |
|
|
|
« Last Edit: March 21, 2017, 11:05:14 AM by Tglad »
|
Logged
|
|
|
|
|
kram1032
|
|
« Reply #10 on: March 15, 2017, 03:05:06 PM » |
|
Ah so the other coloration would just be chromatic aberration, the lens defect? Seems unnecessary. It'd not be fractal-specific. What you already cover, then, is what you get from grid diffraction, right? (As in the image of the spectrum I showed below) Color space conversions apparently are far from trivial. To properly convert between wavelengths and RGB you need to know what color space you are working in and stuff like that. It can be really fiddly. However, I think a linear space (which sRGB isn't) probably would make stuff simpler. Black body radiation is basically a particular energy spectrum that's being emitted at particular temperatures. The sun has a surface of 5777K, so that's the color it glows in, however the sky, at least during day time, takes away some of the high energy radiation that's instead coming seemingly uniformly from everywhere, so the sun looks a bit warmer (which oddly enough means it looks like it has a lower temperature) but the sky adds a ton of cool ambient light. I think a common white point is typically set at like 6500K. Planck's Law states:  Where I is the power (the energy per time unit) that's being emitted. The constant in front amounts to 1.4745*10 -50kg s (kilograms seconds, a weird unit of course), but you can basically forget about that. It's just a scaling factor. We're only interested in the The actual interesting part then is  The range that interests us is  . So to get the right sample distribution, you'd follow the very simple Markov Chain Monte Carlo sampling algorithm. I hope the following example in Python is readable enough as well as error-free (it's been a while that I actually implemented something like this): from math import exp, floor, ceil
import random
import numpy as np
from matplotlib import pyplot as plt
C = .70351417223810256 # prefactor such that peak is 1
K = 4.79924 # prefactor if units are in PHz and 10^4 K
# desired range for v is .4 to .789
# desired range for T is 7.98e-2 to 2.
# typical range would be .5 to .7, commonly .65
def Planck(v, T): # the distribution of spectral frequencies for a given temperature
KTv = K * v / T
return C * KTv * KTv * KTv * v * v / (exp(KTv) - 1)
def MC(T): # generates samples from the distribution using Markov Chain Monte Carlo method
v0 = random.uniform(.4, .789)
I0 = Planck(v0, T)
while True:
v = random.uniform(.4, .789)
I = Planck(v, T)
a = I/I0
if a >= 1:
v0 = v
I0 = I
else:
p = random.random()
if a <= p:
v0 = v
I0 = I
yield v0
# a bunch of utility functions to get to proper units
def to_eV(v):
return v * 4.135668
def to_nm(v):
return 299.8/v
def from_K(T):
return T * 1.e-4
def from_THz(v):
return v * 1.e-3
# example histogram for some temperature
temp = 6500 # in Kelvin
data = [to_nm(v) for v, _ in zip(MC(from_K(temp)), range(100000))] # in nanometers, from 100k samples.
binbot = ceil(min(data))
bintop = floor(max(data))
bincount = int(bintop-binbot)
bins = np.linspace(binbot,
bintop,
bincount)
plt.xlim([min(data), max(data)])
plt.hist(data, bins=bins, alpha=0.5)
plt.title('spectral distribution of ' + repr(temp) + 'K light source')
plt.xlabel('nm')
plt.ylabel('count')
plt.show()
If you find a way to properly mix and covert spectral values into RGB, then this would be the method to sample from a given blackbody radiation lightsource. I'm well aware that this is the easier part. The conversion ought to be more convoluted. |
|
|
|
|
Logged
|
|
|
|
|
kram1032
|
|
« Reply #11 on: March 15, 2017, 08:56:17 PM » |
|
Hmm, I was trying to generate the conversion from spectrum to RGB and at this point I'm pretty much convinced that the below code for sampling from the spectrum is incorrect. I somehow get the right peak wavelength but it's emphasized much too strongly. Effectively I have super saturated light. Presumably I'm doing something wrong with the MC sampling. If somebody can spot the error I'd much appreciate it.
Assuming that indeed is where my error lies, converting to RGB will be easier than I thought. All I need to do, apparently, is first convert to XYZ color space via some matrix transformation given by CIE, then add up all my values in that space, then normalize as wanted and convert to an appropriate color space, for instance sRGB, which is just another simple matrix transformation.
|
|
|
|
|
Logged
|
|
|
|
claude
Fractal Bachius
Posts: 563
|
|
« Reply #12 on: March 15, 2017, 09:04:46 PM » |
|
The hardest part is wavelength to XYZ, which you can do by looking up into a table of tristimulus response curves. EDITED to add, I once collected some facts from wikipedia into a small reference document: https://mathr.co.uk/misc/2015-04-04_colour.pdf maybe is useful |
|
|
|
« Last Edit: March 15, 2017, 09:10:52 PM by claude, Reason: booklet link »
|
Logged
|
|
|
|
|
kram1032
|
|
« Reply #13 on: March 16, 2017, 12:16:08 AM » |
|
I'm basically doing that but I get a super saturated cyan (if I use XYZ to sRGB as I found on some website) or super saturated purple (if I give wolfram alpha the resulting XYZ values and ask it to give me the color).
I think I may have flipped a < in the MC function. It makes more sense to have it go the other way from how I put it in the function. If I change that, I get a bluish grey which is a lot better (I'm not entirely sure which values are supposed to be exactly white. Probably .33 for all three?) but then the spectrum does NOT peak where it is supposed to, whereas with the opposite convention it peaks right where I want it to but it's evidently too narrow.
Something really weird is going on here. I must misremember something about how the MC algorithm works. Or else, the spectrum-to-XYZ and/or XYZ-to-RGB data I got are bogus.
|
|
|
|
|
Logged
|
|
|
|
Tglad
Fractal Molossus
Posts: 703
|
|
« Reply #14 on: March 16, 2017, 12:46:53 AM » |
|
"Ah so the other coloration would just be chromatic aberration, the lens defect? Seems unnecessary. It'd not be fractal-specific." which other coloration do you mean? I talked about coloration due to total internal reflection when the curve is translucent, the main effect is when reflected light and refracted light interfere, it causes some of the brighter plumage on parrots for instance. "What you already cover, then, is what you get from grid diffraction, right?" well it is the same principle I suppose, but the diagram I gave with the blue waves is clearer than anything I could write. What I am less clear on is the origin of the beam width (where light interferes rather than intensities adding linearly), one justification is that all lenses can only focus to a small spot size (not a point), so equivalently, any point on your retina (a cone for instance) gets light from a small spot on the fractal. Does this justify interference? or is it to do with the spatial coherence of the incident light source? Either way, the spot size doesn't affect the colour unless it is tiny, its just more blurry if big. "first convert to XYZ color space via some matrix transformation given by CIE, then add up all my values in that space, then normalize as wanted and convert to an appropriate color space, for instance sRGB, which is just another simple matrix transformation." Yes, this is what the code in answer 6 of the link I mentioned does ( http://stackoverflow.com/questions/1472514/convert-light-frequency-to-rgb). It uses an analytic approximation of the light sensitivity curves to get to XYZ then converts to RGB. I don't think I'll try a black body white light as, well its all getting pretty complicated! and I think at this point the results won't look too different, probably a bit more green in them. The interesting result for me is that the curve changes colour with view angle (flipping every 30 degrees) even under ambient light. Perhaps some crystals are like this? if so then the connection is just that both are regular shapes... the randomised Koch curve had no colour on average. Or perhaps I'm just doing it wrong Thanks for the link Claude, I must read this and gain some more understanding. I'll also chuck the code on github. |
|
|
|
|
Logged
|
|
|
|
|


