fractower
Iterator

Posts: 173
|
 |
« Reply #60 on: December 01, 2012, 05:45:17 PM » |
|
I notice that symmetry is broken in some graphs for higher energies. I would assume that the physics is still symmetric. Is this caused by the initial conditions? For example is it a matter of spinning clockwise vs counter clockwise?
|
|
|
|
|
 Logged
|
|
|
|
bkercso
Fractal Lover
Posts: 220
|
|
« Reply #61 on: December 01, 2012, 09:08:30 PM » |
|
We can see the broken symmetric in higher enegies, yes. (Maybe it breaks also in lower energies but because of the limited resolution we cannot see this (?). ) As you wrote, the only asymmetricity we put into the system is the initial conditions, and this is enough, so the motion is not symmetric. Values on the vertical axis are +- values, the midpoint of the axis is the zero point.
|
|
|
|
« Last Edit: December 01, 2012, 09:10:21 PM by bkercso »
|
Logged
|
|
|
|
fractower
Iterator
Posts: 173
|
|
« Reply #62 on: December 01, 2012, 09:21:15 PM » |
|
Can you integrate the total accumulated angle of each pendulum (How many times they spin around)? This would provide one test for the broken symmetry.
|
|
|
|
|
Logged
|
|
|
|
bkercso
Fractal Lover
Posts: 220
|
|
« Reply #63 on: December 01, 2012, 09:35:32 PM » |
|
I already integrated it in my head: zero.  Even at max energy theta1_initial=0, theta2_initial=179.9°. So the pendulums don't spin around. The asymmetricity what we see is something this: at X energy quasi-periodic points are around theta2=Y1, Y2 and -Y1+dy1, -Y2+dy2 (so when omega1=0 then theta2= around Ys). As at lower energy there are hundreds of quasi-periodic points maybe dys are less, if they are exist. Img #6 (again) 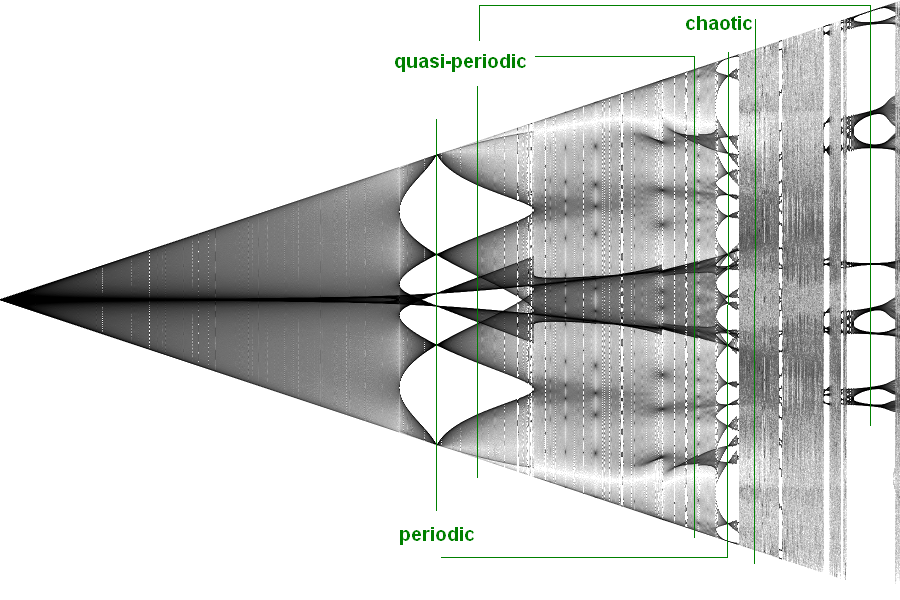 |
|
|
|
« Last Edit: May 27, 2015, 04:13:57 PM by bkercso »
|
Logged
|
|
|
|
fractower
Iterator
Posts: 173
|
|
« Reply #64 on: December 01, 2012, 10:14:29 PM » |
|
I assume by maximum energy you mean both pendulums pointing up. If the system starts with that energy, then if the fixed pendulum is pointed up and the second pendulum is pointed down there will be enough energy for the primary pendulum to roll over.
|
|
|
|
|
Logged
|
|
|
|
|
kram1032
|
|
« Reply #65 on: December 01, 2012, 11:00:56 PM » |
|
That's maximum potential energy. However, if you put them *exactly* upright, you're actually in an unstable equilibrium and they would just stay like that.
|
|
|
|
|
Logged
|
|
|
|
bkercso
Fractal Lover
Posts: 220
|
|
« Reply #66 on: December 02, 2012, 08:44:58 PM » |
|
No, the upper pendulum starts at 0° (=theta1_initial) and the other pendulum starts 0..179.9° (=theta2_initial). If I enable to roll over (put enough energy for this) the motion will be too chaotic and I won't get nice patterns. Anyway the motion is asymmetric, like this: http://article.wn.com/view/2009/12/09/Double_pendulum_video/ |
|
|
|
|
Logged
|
|
|
|
bkercso
Fractal Lover
Posts: 220
|
|
« Reply #67 on: December 03, 2012, 12:33:49 AM » |
|
Do you think you could try to do one of those? Like, add up the per-iteration results not directly as exposures but rather as varying wavelengths of light.
I've done a fast calculation with Img #6's setup for check your idea. I increased pixel values 't(from previous event)/dt_min/10' instead of '1' at every event (when motion meets the rendering criterion). The result almost the same then Img #6. It's interesting... Coloring is the same, points/pixel rate is almost the same (=4 vs 6). But it has less color depth, I think because of the following: which pixel are hitted more often there get less 't/dt_min/10' because 'more often' --> 'less time from previous event'. But we can see the patters so 'more often' wins over 'less time from previous event' (consider we don't know the sequence of points). Img #16Alternative bifurcation diagram 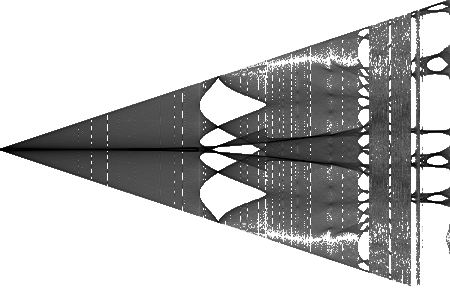 |
|
|
|
« Last Edit: May 27, 2015, 04:14:48 PM by bkercso »
|
Logged
|
|
|
|
|
cKleinhuis
|
|
« Reply #68 on: December 03, 2012, 12:41:12 AM » |
|
too bad it is too small  |
|
|
|
|
Logged
|
---
divide and conquer - iterate and rule - chaos is No random!
|
|
|
bkercso
Fractal Lover
Posts: 220
|
|
« Reply #69 on: December 03, 2012, 01:47:45 AM » |
|
Yes, this is a pilot run (took half an hour of my life ). Img #17Same but increased pixel with '10000*theta1 (with sign)' instead of '1'. 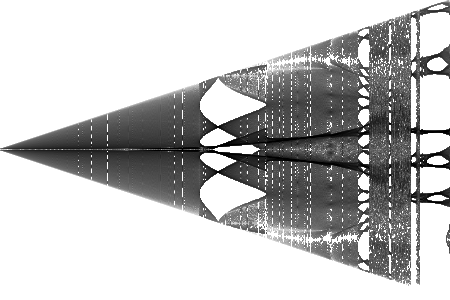 Img #18 Img #18Increased pixel with 100*abs(theta1). 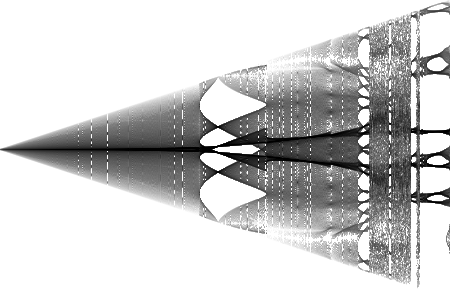 The patterns are very stable! ( Probably the lower color depth at Img #16,#17 caused by high values of pixels; because of this I used 100*abs(theta1) last time instead of 10000*abs(theta1). In white area the pixel value =0, so the interval between maxvalue-minvalue was small vs. maxvalue-0 what I colored with grayscale.). My first explanation for the stability of patterns: correlation between theta2 vs time/theta1 is poor. If I see the Poincaré-section which I generated I am strengthened in this. So doesn't matter if I increase pixel value with '1' or with a 'random value'. Here is the theta2 vs theta1 Poincaré-section of Img #6's setup @theta2_initial=160° (rendering criterion was the same: omega1=0):  BUT: theta2_initial=160° is a chaotic region. In a quasi-periodic region this would be 2 curves, which means a higher correlation. So my explanation is not an evidence for me yet... 2 curves @theta2_initial=128°:  |
|
|
|
« Last Edit: May 27, 2015, 04:17:51 PM by bkercso »
|
Logged
|
|
|
|
|
cKleinhuis
|
|
« Reply #70 on: December 03, 2012, 04:30:10 AM » |
|
so, dont really got what you changed, are the lighter areas lesser visited ?!
|
|
|
|
|
Logged
|
---
divide and conquer - iterate and rule - chaos is No random!
|
|
|
|
cKleinhuis
|
|
« Reply #71 on: December 03, 2012, 04:32:35 AM » |
|
btw, have you tried rendering a 1 dimensional mandelbrot bifurcation diagram !? i mean you can execute the mandelbrot function simply on a real number base z^2+c ...
|
|
|
|
|
Logged
|
---
divide and conquer - iterate and rule - chaos is No random!
|
|
|
|
kram1032
|
|
« Reply #72 on: December 03, 2012, 08:56:36 AM » |
|
so basically, the color mixing makes it all grey?
|
|
|
|
|
Logged
|
|
|
|
bkercso
Fractal Lover
Posts: 220
|
|
« Reply #73 on: December 03, 2012, 11:10:22 AM » |
|
so, dont really got what you changed, are the lighter areas lesser visited ?!
Lighter areas has less value. I registered under pixel 100*abs(theta1) at every visit, not the number of visit events. btw, have you tried rendering a 1 dimensional mandelbrot bifurcation diagram !? i mean you can execute the mandelbrot function simply on a real number base z^2+c ...
On which real number it is working? if z<1 then z^2<z else z^2>=z. If I take complex z with fixed Im(z)=0 my z(i) points will has Im(z(i))<>0. so basically, the color mixing makes it all grey?
If I understood correctly you based coloring on pixel values, and based pixel values on trajectory. I based coloring on pixel value, based pixel value on other parameter of system. And I used greyscale color palette. Is it the same? |
|
|
|
« Last Edit: December 03, 2012, 11:45:24 AM by bkercso »
|
Logged
|
|
|
|
bkercso
Fractal Lover
Posts: 220
|
|
« Reply #74 on: December 03, 2012, 12:56:32 PM » |
|
(This topic has the most replies in this category!  ) |
|
|
|
|
Logged
|
|
|
|
|


