|
Alef
|
 |
« on: May 09, 2017, 04:33:30 PM » |
|
Well, not so new. I noticed this few years agou when doing this http://www.fractalforums.com/fractal-programs/problems-with-implementing-budhabrot-in-uf/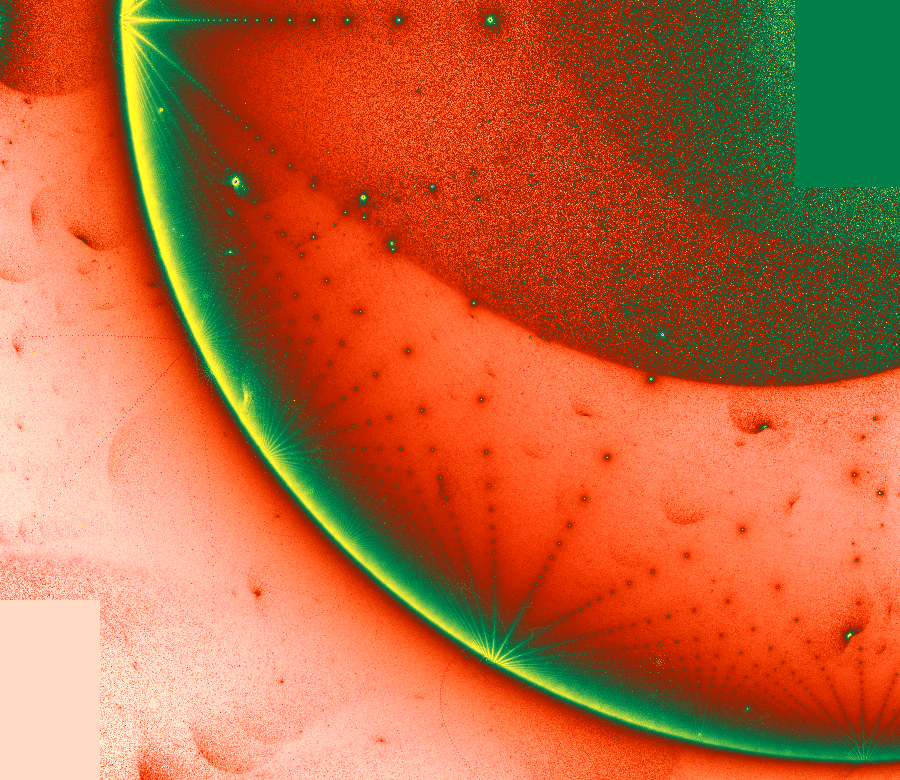 All the explanations in videos. http://www.fractalforums.com/movies-showcase-(rate-my-movie)/brahmabrot-orbit-plot-anim/But there is something going on with the dots of concentrations of orbits. They are so nicely spread and stable that they should be part of mandelbrot set. Throught they are nicely visible only with certain colour conditions. But the better the render the better they are visible. These dots first appeared only when I took out the largest abundance of non escaping orbits by introducing alsou newton bailout conditions. In antibuddhabrot this feature is well hidden. And in buddhabrot its the escaping orbits. There are lots of folks who know more about M-brot and were goes orbits, as this was how extremely deep zooms were rendered. |
|
|
|
 Logged
|
fractal catalisator
|
|
|
|
Sockratease
|
|
« Reply #1 on: May 09, 2017, 10:20:53 PM » |
|
That picture makes me want some watermelon! Looks yummy  |
|
|
|
|
Logged
|
Life is complex - It has real and imaginary components. The All New Fractal Forums is now in Public Beta Testing! Visit FractalForums.org and check it out! |
|
|
|
FractalStefan
|
|
« Reply #2 on: May 10, 2017, 01:17:20 AM » |
|
I also noticed these dots when plotting the Z orbits (escaping and non-escaping) using a low number (20) of maximum iterations: 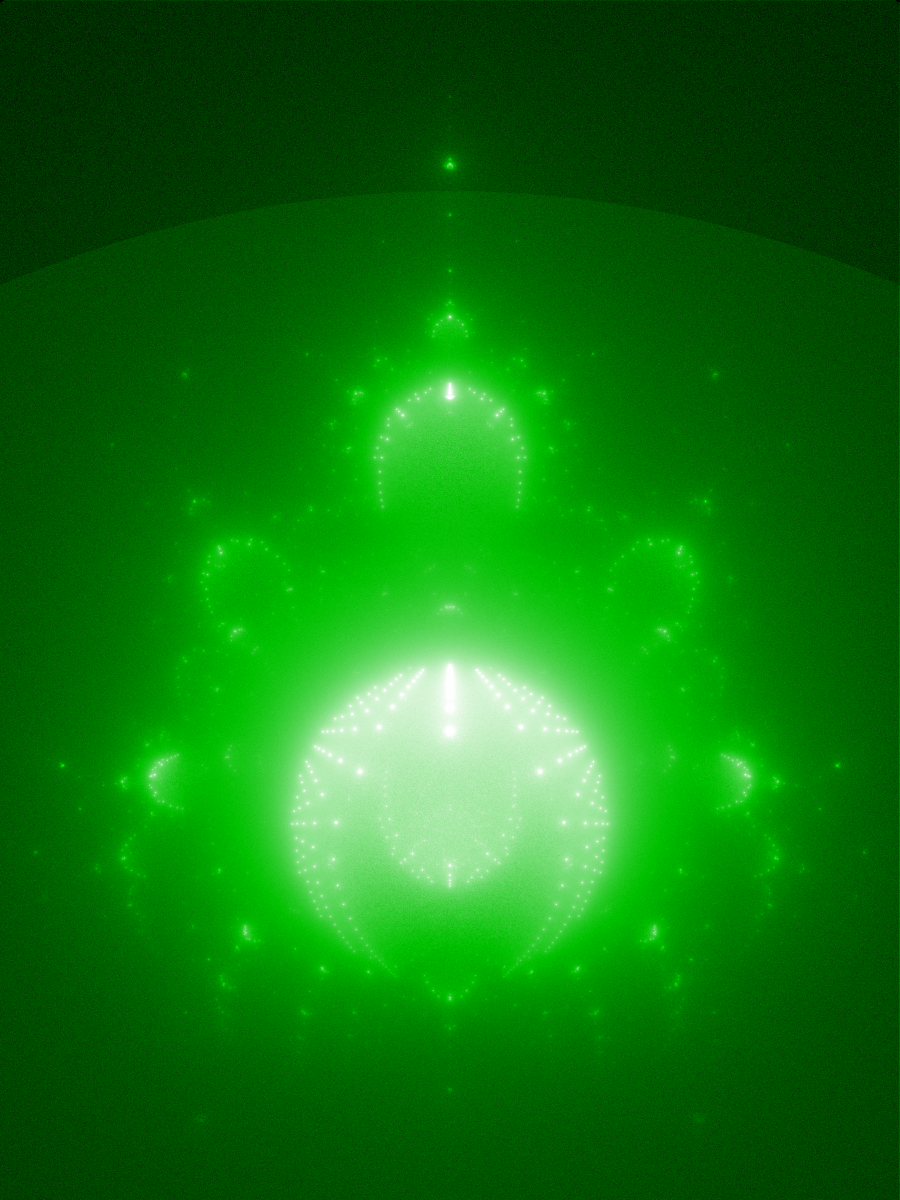 The number of dots is dependent of the number of maximum iterations as this animation shows: http://www.stefanbion.de/fraktal-generator/z-orbits/dots/The more iterations are used, the more these dots are covered by random pixels. At 200 iterations they become almost invisible. (Here I used only 10 million orbits per image. With more orbits the images would be less noisy.) Stefan |
|
|
|
|
Logged
|
|
|
|
|
Softology
|
|
« Reply #3 on: May 10, 2017, 11:20:37 PM » |
|
I think you will find all the dots are actually minibrots (minibuddhabrots) when you zoom into them.
At least that has been my experience. I have never zoomed into a small dot feature and had it not be a minibrot.
Jason.
|
|
|
|
|
Logged
|
|
|
|
|
FractalStefan
|
|
« Reply #4 on: May 10, 2017, 11:51:16 PM » |
|
I think you will find all the dots are actually minibrots (minibuddhabrots) when you zoom into them.
At least that has been my experience. I have never zoomed into a small dot feature and had it not be a minibrot.
Jason. Usually yes, but in the case of these dots, I couldn'd find any "minibrots" when zooming into them. They seem to be just spots of higher density of random pixels. |
|
|
|
|
Logged
|
|
|
|
|
Softology
|
|
« Reply #5 on: May 11, 2017, 03:31:54 AM » |
|
Usually yes, but in the case of these dots, I couldn'd find any "minibrots" when zooming into them. They seem to be just spots of higher density of random pixels.
I am guessing they are artefacts of not enough iterations. I was able to find some dotty areas when zooming into buddhabrots that had the max iterations clamped to 32. Once I bumped the iterations up to thousands and millions the dots went away. Jason. |
|
|
|
|
Logged
|
|
|
|
|
Alef
|
|
« Reply #6 on: May 11, 2017, 04:40:39 PM » |
|
FractalStefan Pretty cool rendering. I mean this http://www.stefanbion.de/fraktal-generator/z-orbits/dots/I think, when max iterations is about some 20, certain low orbits somehow concentrate on this points. But I 'm not shure about this. In my algorithm it took some fixed number of orbits per pixel. And if the max iterations is low it actualy took longer to render the picture. |
|
|
|
|
Logged
|
fractal catalisator
|
|
|
|
Alef
|
|
« Reply #7 on: May 11, 2017, 04:48:34 PM » |
|
Did more, just like on green picture. Since it is realy an orbit density plot these could be something like a stations of majority of shallow orbits. Or something like that. Realy I have no idea how they moves. Since it is my brahmabrot I was able to render a hudge picture of mandelbrot set orbit density plot without spending eternity for it. It was rendered as 4 pictures and then stuck together and then mirrored. But its only visible on carefull examination. Here maxiter is 720. Dots and minibrots goess paralel. Not shure shoild I put this large picture in forums. So here is a link http://orig05.deviantart.net/4701/f/2017/131/8/b/brahmabrot_by_edo555-db8uoj6.pngOf this picture:  |
|
|
|
Logged
|
fractal catalisator
|
|
|
knighty
Fractal Iambus

Posts: 819
|
|
« Reply #8 on: May 11, 2017, 09:22:27 PM » |
|
I think, when max iterations is about some 20, certain low orbits somehow concentrate on this points.
Exactly! It happens because, for some orbits, the derivative becomes (or close to) 0 at some point. |
|
|
|
|
Logged
|
|
|
|
|
Alef
|
|
« Reply #9 on: May 13, 2017, 03:56:19 PM » |
|
:- OK.
Aren't they are going first somewhere throught 0,0 and then elswere around set?
I 'm just doing animation about this. Each max iterations increases numbers of dots but they becomes smaller. It just isn't visible with large max iteration values. And buddhabrot colour algorithm probably isn't good to reveal this becouse of large iteration requirements.
|
|
|
|
|
Logged
|
fractal catalisator
|
|
|
|
Alef
|
|
« Reply #10 on: May 16, 2017, 04:25:28 PM » |
|
Maybe I m starting to understand. It is related to Distance Estimation. These dots could be solutions of derivatives of mandelbrot set at each iteration or like that??? At the two iterations appears a dot at 0,0. One more iteration - two smaller dots. And then more and more dots are sticking to the mandelbrot border. Just that buddhabrot colour algorithm is not too good at revealing this. Just uploaded video about dots:
<a href="http://www.youtube.com/v/9tOqPtV4dEk&rel=1&fs=1&hd=1" target="_blank">http://www.youtube.com/v/9tOqPtV4dEk&rel=1&fs=1&hd=1</a>UF parameter for most of the fractals exept the red one. On these settings dotts are particulary visible. Starbrot_toWhite {
fractal:
title="Starbrot_toWhite" width=428 height=240 layers=1
credits="Alef;5/15/2017"
layer:
caption="Background" opacity=100 method=multipass transparent=yes
mapping:
center=0/0 magn=1.81
formula:
maxiter=1 percheck=off filename="lkm.ufm" entry="pixel"
inside:
transfer=none
outside:
transfer=linear filename="em.ucl" entry="Brahmabrot"
p_sampleDensity=450 p_maxiter=25 p_seedinput=12 p_addhalton=no
p_formula=Mandelbrot p_power=2 p_starpower=3 p_stargeom=0.5
p_unitvector=-0.5 p_talisadd=1 p_quadfactor=2 p_frequency=1 p_spin=1
p_centralorbit=0.5/0 p_settype=Mset p_julia=-0.4/0.25 p_srcWidth=5
p_srcHeight=4 p_switchRGB=None p_ambient=-0.85 p_postfn="0- None"
p_palette="Direct Colouring" p_equalisation=no p_sigmoidlight=10
p_lightR=0.38 p_scalarR=0.7 p_lightG=0.98 p_scalarG=1.6 p_lightB=0.2
p_scalarB=0.3
gradient:
smooth=yes index=0 color=8716288 index=100 color=16121855 index=200
color=46591 index=300 color=156
opacity:
smooth=no index=0 opacity=255
}
|
|
|
|
|
Logged
|
fractal catalisator
|
|
|
|
FractalStefan
|
|
« Reply #11 on: May 16, 2017, 04:39:11 PM » |
|
Maybe I m starting to understand. It is related to Distance Estimation.
These dots could be solutions of derivatives of mandelbrot set at each iteration or like that??? At the two iterations appears a dot at 0,0. One more iteration - two smaller dots. And then more and more dots are sticking to the mandelbrot border.
I'm not sure about this, but at least the dots are spots of maximum probability where Z-points will be located during the iterations of the corresponding random starting points C. If the individual Z-orbits are plotted one by one, no such cumulation at certain spots can be observed - only the sum of all orbits will be visible as dots. |
|
|
|
|
Logged
|
|
|
|
|
Alef
|
|
« Reply #12 on: May 16, 2017, 05:50:09 PM » |
|
Indeed. They could be something like atractors.
For some reason there appear some individual orbits as pixel sized dots of different colour. Maybe becouse random number hit it twice or like that. And they mostly look like spirals.
|
|
|
|
|
Logged
|
fractal catalisator
|
|
|
|