HPDZ
Iterator

Posts: 157

|
 |
« Reply #30 on: October 01, 2009, 04:02:18 AM » |
|
Here are the coordinates:
X (Real axis): -0.7446103231585
Y (Imag axis): 0.0865319890292
Size: 8e-6
Iteration limit: 50000
|
|
|
|
|
 Logged
|
|
|
|
HPDZ
Iterator
Posts: 157
|
|
« Reply #31 on: October 01, 2009, 05:14:15 AM » |
|
Here are the unfiltered images, shown with the histogram method that Duncan C described (well, my implementation of what I believe to be essentially the same technique) and my rank-order method that was used to colorize all the supersampled images. You can see that neither colorizing technique is particularly effective at reducing the noise inherent in this image. Original uncompressed BMP files are at www.hpdz.net/images/TechPics/AA3-Unfiltered-Histogram.bmp and www.hpdz.net/images/TechPics/AA3-Unfiltered-RankOrder.bmpHistogram colorizing image is below: 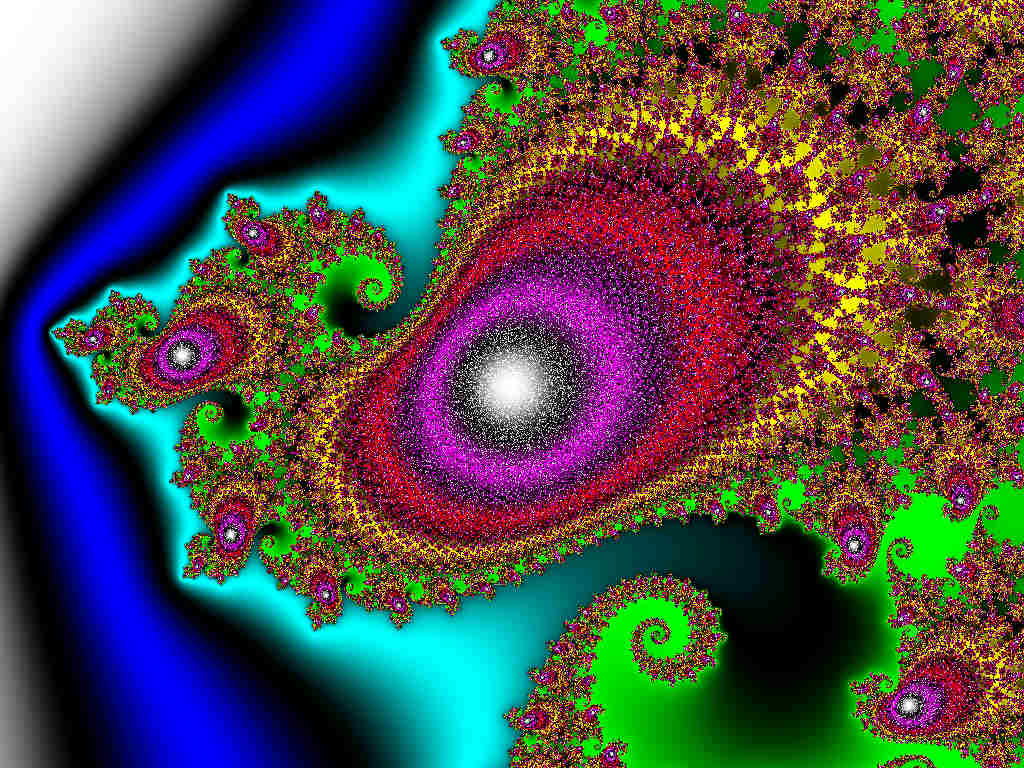 Rank-Order colorizing image is below: 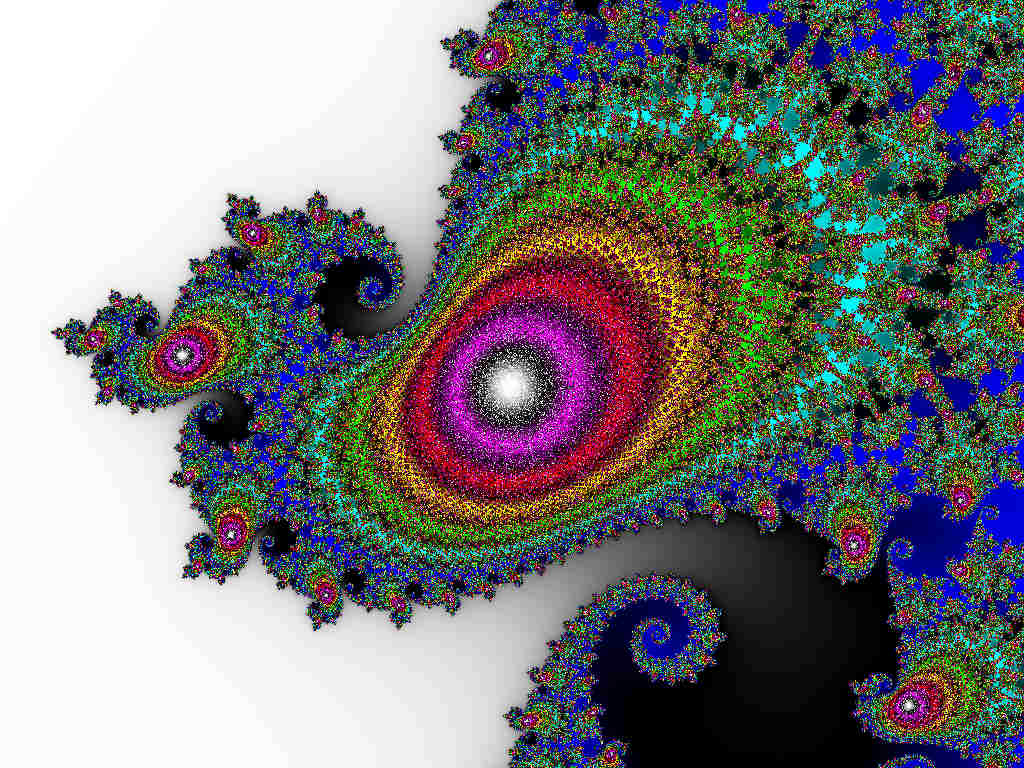 |
|
|
|
|
Logged
|
|
|
|
|
Duncan C
|
|
« Reply #32 on: October 01, 2009, 12:13:09 PM » |
|
HPDZ,
Did you see my sample image, one post above yours? It looks like you posted while I was composing me message so you may not have gotten notice.
When I created my image I had not gotten your coordinates, so I guessed.
Duncan C
|
|
|
|
|
Logged
|
Regards,
Duncan C
|
|
|
HPDZ
Iterator
Posts: 157
|
|
« Reply #33 on: October 01, 2009, 01:46:47 PM » |
|
Duncan,
Yes, I did see it, but I forgot to comment on it last night.
It definitely looks less noisy than my test images. I would be interested in seeing how your coloring method works on the area that I'm using to make my test images. Please give it a try if you have some free time.
Mike
|
|
|
|
|
Logged
|
|
|
|
|
Duncan C
|
|
« Reply #34 on: October 02, 2009, 03:55:16 AM » |
|
Duncan,
Yes, I did see it, but I forgot to comment on it last night.
It definitely looks less noisy than my test images. I would be interested in seeing how your coloring method works on the area that I'm using to make my test images. Please give it a try if you have some free time.
Mike
Here's my version of your plot: 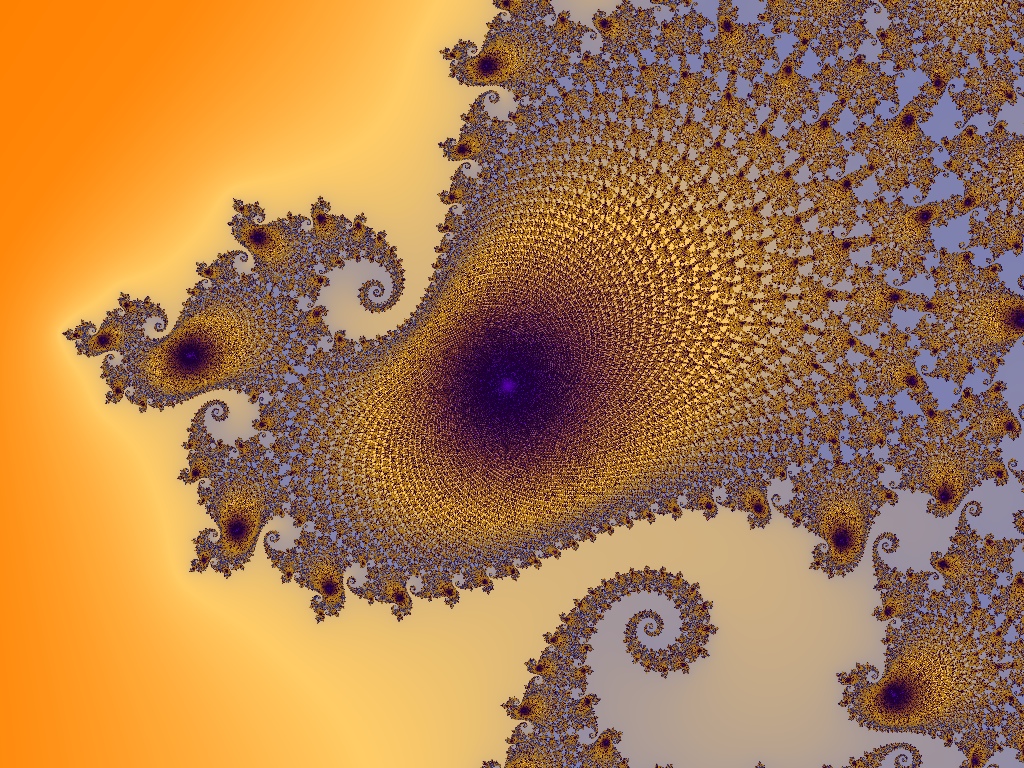 That plot is harder to do cleanly than the one I posted. It has a higher average iteration count, for one thing. Again, this is rendered without any antialiasing. If I wanted a high quality image I would create an oversized image and downsample it. Using distance estimate data to color pixels near the set makes a big difference in clarity. Regards, Duncan |
|
|
|
|
Logged
|
Regards,
Duncan C
|
|
|
HPDZ
Iterator
Posts: 157
|
|
« Reply #35 on: October 02, 2009, 05:53:44 AM » |
|
Duncan,
This image looks pretty darn good. I seem to recall you described your use of the DE to color pixels near the set somewhere previously; could you direct me (and future readers of this thread) to that post, or perhaps describe your method again?
I do notice that the color palette you use is kind of low-contrast; visually, that of course makes it hard to discern how much noise there is. That is why I use an RGB-white (or sometimes a more complex one, like white-magenta-red-yellow-green-cyan-blue) palette for this kind of thing; it is a bit ugly but shows the noise with great contrast.
I am still thinking that a couple of big questions are on the table:
1. Is the median filter better than a mean filter (or any other type of linear filter) as the thing to do the down-sampling from the supersampled data (I believe it is, although it may not be the absolute best possible filter)
2. Does increasing the supersampling grid size make the details of the filter irrelevant -- that is, do all "reasonable" filters converge to the same thing when applied to an NxN supersampling grid, as N gets arbitrarily large? I think the answer is definitely NO.
To further explore item (1) I am going to generate a bunch of statistics on the distributions of counts in the vicinity of the boundary of the set, then apply a median filter and a simple mean filter (and maybe some more complex linear filters) to it and see what happens. I think the median filter is superior because it is so robust against outliers, and I suspect the count distribution near the edge of the set is highly skewed. The mean filter, and variations on it, will over-emphasize the tails of the distribution and result in much noisier output. I don't think this question has been explored much in the DSP literature, actually. Maybe some young EE grad student could take this up as a project....
I consider item (2) closed, since it is patently obvious that a filter like the mean will always give a totally different value than the median for a noisy process with a skewed distribution, no matter how large the supersampling grid is. Which filter is "better" is a different matter, but I think the question of whether the images converge to a single, common, "perfect" image as the supersampling grid gets infinitely large is definitely not what actually happens.
OK. Fascinating topic. I have bugs to kill now on other issues, and an early day tomorrow. (I get to go shoot some guns at the firing range of our Sheriff's department tomorrow; should be fun).
Mike
|
|
|
|
|
Logged
|
|
|
|
|
Duncan C
|
|
« Reply #36 on: October 04, 2009, 12:01:01 AM » |
|
Duncan,
This image looks pretty darn good. I seem to recall you described your use of the DE to color pixels near the set somewhere previously; could you direct me (and future readers of this thread) to that post, or perhaps describe your method again?
I do notice that the color palette you use is kind of low-contrast; visually, that of course makes it hard to discern how much noise there is. That is why I use an RGB-white (or sometimes a more complex one, like white-magenta-red-yellow-green-cyan-blue) palette for this kind of thing; it is a bit ugly but shows the noise with great contrast.
I am still thinking that a couple of big questions are on the table:
1. Is the median filter better than a mean filter (or any other type of linear filter) as the thing to do the down-sampling from the supersampled data (I believe it is, although it may not be the absolute best possible filter)
2. Does increasing the supersampling grid size make the details of the filter irrelevant -- that is, do all "reasonable" filters converge to the same thing when applied to an NxN supersampling grid, as N gets arbitrarily large? I think the answer is definitely NO.
To further explore item (1) I am going to generate a bunch of statistics on the distributions of counts in the vicinity of the boundary of the set, then apply a median filter and a simple mean filter (and maybe some more complex linear filters) to it and see what happens. I think the median filter is superior because it is so robust against outliers, and I suspect the count distribution near the edge of the set is highly skewed. The mean filter, and variations on it, will over-emphasize the tails of the distribution and result in much noisier output. I don't think this question has been explored much in the DSP literature, actually. Maybe some young EE grad student could take this up as a project....
I consider item (2) closed, since it is patently obvious that a filter like the mean will always give a totally different value than the median for a noisy process with a skewed distribution, no matter how large the supersampling grid is. Which filter is "better" is a different matter, but I think the question of whether the images converge to a single, common, "perfect" image as the supersampling grid gets infinitely large is definitely not what actually happens.
OK. Fascinating topic. I have bugs to kill now on other issues, and an early day tomorrow. (I get to go shoot some guns at the firing range of our Sheriff's department tomorrow; should be fun).
Mike
Mike, The DE algorithm is documented in "The Science of Fractal Images." There are versions for both Mandelbrot and Julia sets. If you don't have that information, let me know. I think there are also some websites that describe it. Here's what I do: Users specify a color to use for "near neighbor" pixels that are closer than some threshold value to the set. Users can specify a threshold DE value. Pixels with a DE value > the threshold are unchanged. Users can also specify an adjustment value which changes the curve used to apply color change to pixels near the set. (original color * (1-DE_weight) + new_color * DE_weight for each color channel) There is also an option to suddenly change a pixel's color if it's DE value is small enough (if the pixel is close enough to the Mandelbrot/Julia set) instead of a transition from the original pixel color to the "near neighbor" color. The pixel coloring code: Scales the DE value based on pixel size (plot_width_real / pixels_wide) Selects pixels with DE value <= threshold. calculates DE weight value 0.0 -> 1.0, and large near set: DE_weight = (threshold - DE_value) / threshold Adjusts DE weight value using adjustment factor ranging from .01 to 6: DE_weight = (1-DE_weight)^adjustment_factor) Adjustment factors <1 cause slow color change further from the set and rapid color change for pixels near to the set. Adjustment factors >1 cause rapid color change further from the set and slow color change near to the set. An adjustment factor of 1.0 applies a linear transition. (since X^1 = X for all X) Finally, Use DE_weight to adjust color of pixel from starting color to neighborhood color (original color * (1-DE_weight) + new_color * DE_weight for R,G, and B color values separately.) Sorry it took me so long to respond. I had bugs to squash myself. Is that understandable? This stuff is hard to describe briefly and clearly. Duncan C |
|
|
|
« Last Edit: October 04, 2009, 01:29:34 AM by Duncan C »
|
Logged
|
Regards,
Duncan C
|
|
|
HPDZ
Iterator
Posts: 157
|
|
« Reply #37 on: October 06, 2009, 03:20:29 AM » |
|
Duncan,
I will digest this when I have some time later this week. At first glance it looks like it can be broadly categorized as a very wickedly complicated, nonlinear, and non-supersampling filter.
So really, strictly speaking, it is not quite actually doing anti-aliasing, although it certainly produces nice results.
Mike
|
|
|
|
|
Logged
|
|
|
|
|
Duncan C
|
|
« Reply #38 on: October 06, 2009, 03:42:00 PM » |
|
Duncan,
I will digest this when I have some time later this week. At first glance it looks like it can be broadly categorized as a very wickedly complicated, nonlinear, and non-supersampling filter.
So really, strictly speaking, it is not quite actually doing anti-aliasing, although it certainly produces nice results.
Mike
"Very wickedly complicated?" Nah. It's just a non-linear way of coloring pixels that are close to the Mandelbrot/Julia set. You can also simply force pixels who's DE value is below some threshold to a different color. That produces a noisy-looking image however. Using a non-linear color transition "feathers" the color change with much less computations than supersampling. Raising a value from 0 to 1 to a power >0 <=6 allows you to easily adjust the slope of the transition to be steeper at either the beginning or the end. I use that approach in several places in my program. I also use it to adjust the steepness of my 3D height maps. Duncan C |
|
|
|
|
Logged
|
Regards,
Duncan C
|
|
|
HPDZ
Iterator
Posts: 157
|
|
« Reply #39 on: October 07, 2009, 07:35:59 AM » |
|
Duncan,
By "very wickedly complicated" I was comparing to traditional digital filters. Operationally, from the standpoint of fractal software, it is pretty straightforward. But mathematically, its properties as a digital filter are very tricky to characterize (I'm not even sure you could define a reasonable modulation transfer function for it). Indeed, its behavior is not even spatially constant -- it does different things to similar input data depending on how close to the edge of the M-set you are.
What's interesting about your approach is that is may actually be true anti-aliasing of the fractal image in a way I had thought was impossible. It is effectively band-limiting the signal prior to sampling by using the DE to detect areas that have above-Nyquist spectral energy and replacing them with a smooth, band-limited function. Using the DE is kind of like having a little angel sitting there at the front of your digital sampling process looking at the data that is about to go into each sample and deciding whether there is likely to be too much above-Nyquist energy. The DE "knows" whether a pixel is going to have an area of extreme noise because it can detect proximity to the set.
This approach obviously relies heavily on the fact that the underlying signal that is being sampled is the Mandelbrot set (or a fractal like it) and cannot be generalized to arbitrary digital images, for which there is no way to create the magic angel that tells you when you are getting into an area of out-of-band noise.
I like it.
Mike
|
|
|
|
|
Logged
|
|
|
|
|
Duncan C
|
|
« Reply #40 on: October 09, 2009, 11:29:57 PM » |
|
Duncan,
By "very wickedly complicated" I was comparing to traditional digital filters. Operationally, from the standpoint of fractal software, it is pretty straightforward. But mathematically, its properties as a digital filter are very tricky to characterize (I'm not even sure you could define a reasonable modulation transfer function for it). Indeed, its behavior is not even spatially constant -- it does different things to similar input data depending on how close to the edge of the M-set you are.
What's interesting about your approach is that is may actually be true anti-aliasing of the fractal image in a way I had thought was impossible. It is effectively band-limiting the signal prior to sampling by using the DE to detect areas that have above-Nyquist spectral energy and replacing them with a smooth, band-limited function. Using the DE is kind of like having a little angel sitting there at the front of your digital sampling process looking at the data that is about to go into each sample and deciding whether there is likely to be too much above-Nyquist energy. The DE "knows" whether a pixel is going to have an area of extreme noise because it can detect proximity to the set.
This approach obviously relies heavily on the fact that the underlying signal that is being sampled is the Mandelbrot set (or a fractal like it) and cannot be generalized to arbitrary digital images, for which there is no way to create the magic angel that tells you when you are getting into an area of out-of-band noise.
I like it.
Mike
Mike, I'm not sure it's a filter, in the way the term is usually used. Since fractals like the Mandelbrot set have an infinite level of detail, the terms usually used for spectral analysis are not strictly applicable My histogram-based color scheme accomplishes a similar result. The number of pixels at a given iteration value is at least roughly inversely proportional to the frequency of change at that iteration value. Thus, if you use a small color change between pixels for iteration values that occur infrequently, you hide data that appears as noise at your current sampling frequency (aka pixel grid size). As the pixel count for a given iteration value goes up, the color delta between iteration values increases also. Duncan C |
|
|
|
|
Logged
|
Regards,
Duncan C
|
|
|
|
xenodreambuie
|
|
« Reply #41 on: October 10, 2009, 03:19:26 AM » |
|
I'm not sure it's a filter, in the way the term is usually used.
Since fractals like the Mandelbrot set have an infinite level of detail, the terms usually used for spectral analysis are not strictly applicable
I'm sure! Spectral analysis is no stranger to infinite detail in one domain or other. In a general situation, you have point sampled data at some resolution. Lacking other information, the simplest way to antialias is to supersample and combine with some filter kernel. But if you convert the data to a distance field, each point contains implicit data about nearby points. Then you can take fewer samples for the same quality result. Taking just one sample still gives a better result than several samples of the raw data would. Creating the distance field from the raw samples is itself a filter operation; it just happens that with the DE formula you don't need to process the individual samples to get the value. It is a shortcut for what can be a relatively expensive filter (depending on the number of dimensions and the bounds.) The DE can be used for any differentiable function. However there are issues with fractals having negative exponents or inversions, as regions of apparent inside or outside tend to be embedded in each other, even with high bailout and iteration limits. At least in my limited experiments with this. |
|
|
|
|
Logged
|
|
|
|
|
Duncan C
|
|
« Reply #42 on: January 01, 2010, 01:37:56 AM » |
|
What's interesting about your approach is that is may actually be true anti-aliasing of the fractal image in a way I had thought was impossible. It is effectively band-limiting the signal prior to sampling by using the DE to detect areas that have above-Nyquist spectral energy and replacing them with a smooth, band-limited function. Using the DE is kind of like having a little angel sitting there at the front of your digital sampling process looking at the data that is about to go into each sample and deciding whether there is likely to be too much above-Nyquist energy. The DE "knows" whether a pixel is going to have an area of extreme noise because it can detect proximity to the set.
Mike, Histogram-based coloring does much the same thing. It decreases the color change between iteration values when the rate of change is high, and increases the color change between iterations when the rate of change is low. This has the effect of hiding changes that occur too fast for the current pixel size. Duncan C |
|
|
|
|
Logged
|
Regards,
Duncan C
|
|
|
|
Botond Kósa
|
|
« Reply #43 on: April 02, 2010, 01:16:17 PM » |
|
Is the median filter better than a mean filter (or any other type of linear filter) as the thing to do the down-sampling from the supersampled data (I believe it is, although it may not be the absolute best possible filter)
Mike, I see you always apply filtering to the iteration values, not the colors. Although this preserves the color tone typical for the subsamples, it leaves in some noise regardless of the filtering type you use (mean or median). In my opinion, filtering the colors (RGB values) is the only efficient way to remove noise, but it has the unpleasant effect of turning the noisy parts of the image into middle gray, because as you use more subsamples, the average of their RGB values converges to 128. I use a compromise in my own fractal generator application. After calculating the n*n subsamples, I sort them into increasing order, but instead of picking the median and computing the color for it, I compute the colors for the middle half of the samples (the values between the 1/4 and 3/4 of the array), and take the average of these colors. This method filters out the outlier values, just like your median filtering does, has less noise than the median filtering, and doesn't produce such a dull output as the mean filtering of colors. See the attached images. The first one was rendered with mean filtering applied to the colors, the second one with median filtering of the iteration values, and the third one with the combined method described above. All images were computed using 8*8 supersampling. Botond |
|
|
|
Logged
|
|
|
|
|
Botond Kósa
|
|
« Reply #44 on: April 02, 2010, 01:18:15 PM » |
|
Sorry, I couldn't attach the third image to my previous post.
So here it is.
|
|
|
|
Logged
|
|
|
|
|


