lkmitch
Fractal Lover

Posts: 238
|
 |
« Reply #15 on: February 14, 2016, 01:54:32 AM » |
|
Here's another approach to bifurcation diagrams in the Mandelbrot set, to which I alluded in an earlier post.
The parameter c doesn't have to move along a line segment (traditionally, the spike along the negative x axis, more recently, arbitrary diagonal segments). In concept, any curve that can be one-dimensionally parameterized can be used, for examples, circles and other polar curves that are parameterized by the polar angle. There are two interesting regions in the Mandelbrot set whose boundaries can be expressed exactly in easy terms: the main cardioid, (x=r * cos(theta)+0.25, y=r*sin(theta), where r = (1-cos(theta))/2) and the period-2 disk centered at -1 (x = r * cos(theta)-1, y=r*sin(theta), where r=0.25). Also, since the iterate z is complex along any of these other curves, any one-dimensional aspect of z can be plotted. Specifically, the magnitude, real part, imaginary part, and polar angle are easily used.
Here are two examples. They both move c along the boundary of the main cardioid, from theta = -pi to pi, and plotting the real part of z or the imaginary part, respectively.
|
|
|
|
 Logged
|
|
|
|
lkmitch
Fractal Lover
Posts: 238
|
|
« Reply #16 on: February 14, 2016, 01:56:50 AM » |
|
Here are two more examples. These both involve the magnitude of z and the period-2 disk. In the first, c moves along the boundary. The second images uses a rose curve that extends beyond the boundary of the disk. This is a zoom into the bifurcation diagram.
|
|
|
|
Logged
|
|
|
|
hobold
Fractal Bachius

Posts: 573
|
|
« Reply #17 on: February 14, 2016, 12:40:54 PM » |
|
Whoah. Yet another new view on the dynamics of the Mandelbrot formula. Very nice to see that we are not done yet!  Wait, here is another idea: Pick a nice smooth closed curve, e.g. a circle, that is fully inside the Mandelbrot set (i.e. no orbits ever escape). Then plot the limit of all those orbits in the complex plane. In other words, plot the ultimate image of the original circle after "infinite" Mandelbrot iterations. This should be rather boring with a circle in the main cardioid, because all orbits there converge to a fixed point. But within smaller disks / minibrots, where the orbits are attracted to periodic cycles, the original circle should be multiplied, and the various images might be intertwined, woven, braided in interesting ways ...? |
|
|
|
|
Logged
|
|
|
|
claude
Fractal Bachius
Posts: 563

|
|
« Reply #18 on: February 14, 2016, 03:44:26 PM » |
|
If you plot all of the boundaries of the hyperbolic components in this way then you get something that resembles a Buddhabrot (this one has thick lines and colour to make it easier to distinguish different parts): 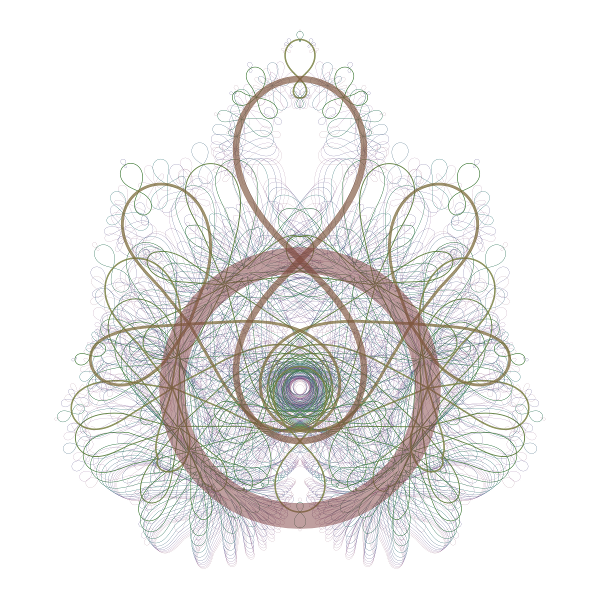 The boundaries of circles get mapped to a leaf/tear shape, then the iterations jump that shape around the complex plane with various distortions. Here's a higher resolution monochrome version: http://mathr.co.uk/tmp/vbb6.png (2.7MB), some glitches/artifacts from the calculation method remain unfortunately... |
|
|
|
|
Logged
|
|
|
|
|
matsoljare
|
|
« Reply #19 on: February 15, 2016, 01:40:50 AM » |
|
Could you extend this to 3D somehow?
|
|
|
|
|
Logged
|
|
|
|
bkercso
Fractal Lover
Posts: 220
|
|
« Reply #20 on: May 27, 2016, 02:20:39 PM » |
|
Really interesting idea, thanks for share and for the software!  Could you please implement arbitrary aspect ration for zoom area selection? |
|
|
|
|
Logged
|
|
|
|
bkercso
Fractal Lover
Posts: 220
|
|
« Reply #21 on: May 27, 2016, 03:16:06 PM » |
|
According to this picturebelow, we should looking for nice bifurcation qhere there is no any apple men. I wonder can we find non-divergent areas which produce nice bifurcation, which differ from the logic map? 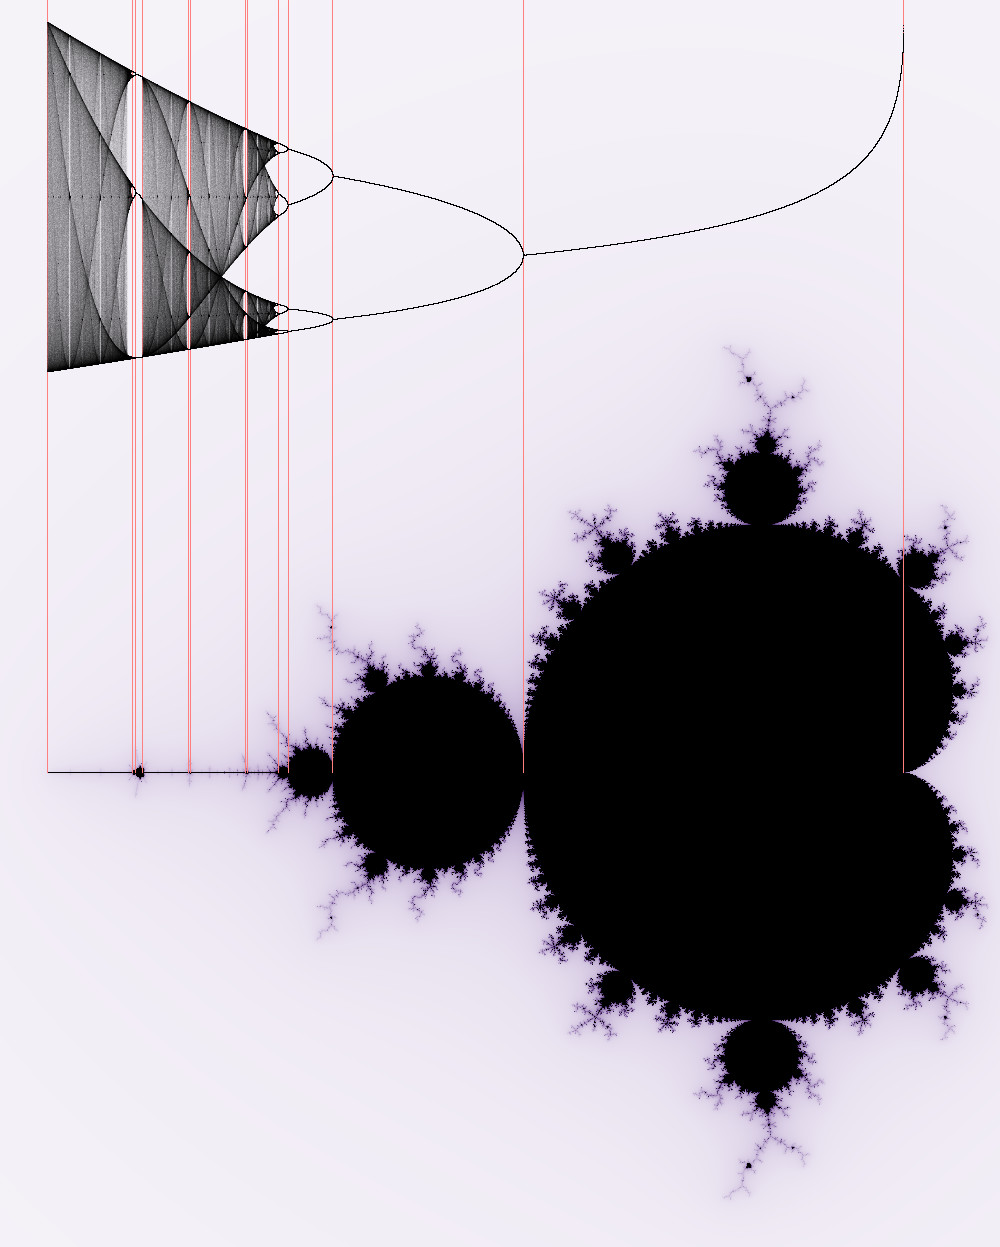 |
|
|
|
|
Logged
|
|
|
|
|
Chillheimer
|
|
« Reply #22 on: May 27, 2016, 03:29:27 PM » |
|
I wonder what happens if you don't use the main branch but one of the smaller bulbs with more than 2 bifurcation branches
|
|
|
|
Logged
|
--- Fractals - add some Chaos to your life and put the world in order. ---
|
|
|
bkercso
Fractal Lover
Posts: 220
|
|
« Reply #23 on: May 27, 2016, 03:44:33 PM » |
|
Nondivergent chaos is placed on the fractal lines which connet the little periodic bulbs (apple men). In apple men, there is nothing interesting just finite priodicity (seen in the pics before: hasn't any finestructure). But if we leave these lines, we find divergent behaviour (these regions also hasn't any infinite fractal structure). Well, these lines have zig-zag geometry, except the real axis, which produces the well know logistic map (?). So we would need an algorithm to fit parameter-line of bifurcation plot to the zig-zag lines of Mandelbrot set. Or is the shape of these lines is known? The zig-zag lines are visible on low iteration numbers: 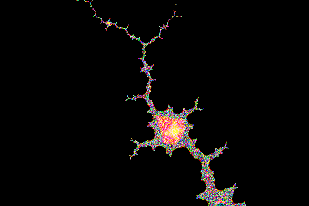 |
|
|
|
« Last Edit: May 27, 2016, 04:18:03 PM by bkercso »
|
Logged
|
|
|
|
bkercso
Fractal Lover
Posts: 220
|
|
« Reply #24 on: May 27, 2016, 04:05:34 PM » |
|
If we stay on real axis as parameter axis, the iterative equation is (for mandelbrot, burning ship and burning bird too) x:=x^2+x0;
x0 is the stepped parameter as well as the initial value too
Is this gives the logistic map? EDIT:Yes, it is (x-axis: -2..2, y-axis: -2..2, both with linear scaling) |
|
|
« Last Edit: May 27, 2016, 04:48:10 PM by bkercso »
|
Logged
|
|
|
|
bkercso
Fractal Lover
Posts: 220
|
|
« Reply #25 on: May 27, 2016, 05:23:00 PM » |
|
I have an idea how to stay on the zig-zag lines:
frame this line with a rectangle frame, draw the midline of it (parallel with zig-zag line), and at first point on this midline calculate the Lyapunov exponent. It is a linear optimization task to find the minimum Lyapunov exponent along the perpendicular direction to midline: here is the point of the zig-zag line, ie. the Mandelbrot set. This is the point where chaos takes place: the edge of divergence and convergence. Repeat this on each point of the midline.
Or, an easier but slower way: along the perpendicular direction to midline, the point of the zigzag line is where the iterative function is not divergent (ie. don't reach the bailout) (requires at least 1000 iterations, and more at zooms). This method is not perfect because of the crossings of the Mandelbrot set; you should find the minimum Lyapuniv exponents.
And another idea:
Use equations of my different nonlinear systems but with complex numbers for create a Mandelbrot-like fractal on the complex plane.
|
|
|
|
« Last Edit: May 27, 2016, 06:27:09 PM by bkercso »
|
Logged
|
|
|
|
|
|
|
Max Sinister
|
|
« Reply #27 on: May 28, 2016, 12:19:31 AM » |
|
This is a topic I'd also like to get deeper into, if only for the graphics.
|
|
|
|
|
Logged
|
|
|
|
|
|
|