|
Duncan C
|
 |
« on: July 18, 2007, 04:29:57 AM » |
|
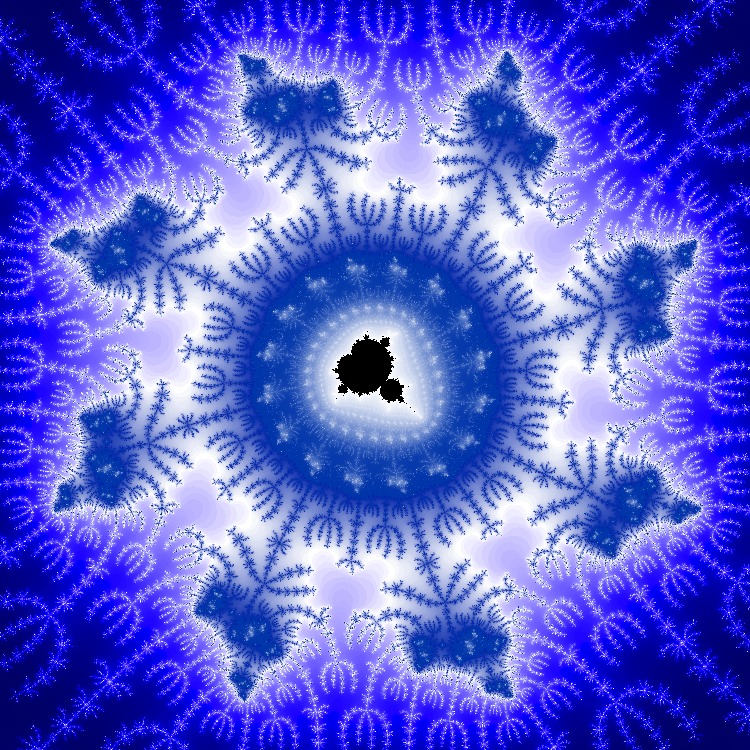 The shapes in this image look like sheep to me, with their heads held up in the air. They appear to be dancing around in a circle, thus the title. So now we know. Androids do indeed dreem of electric sheep. Dancing FRACTAL electric sheep. This is a Mandelbrot plot using escape count coloring for the neighborhoods of the set. The colors are assigned using a histogram of the distribution of iteration values in the plot. The color change is small for iteration values with a small number of pixels, and the color change is large when there are a lot of pixels with that iteration value. This approach to color tables tends to create plots where the structure is easily visible, without a lot of visual "noise" from areas where the iteration value changes rapidly. The result is similar to using exponential color tables, but histogram-based color tables adapt automatically to the distribution of iteration values in the plot. The plot was generated using FractalWorks, a program I am developing for Macintosh computers. Duncan C |
|
|
|
|
 Logged
|
Regards,
Duncan C
|
|
|
|
Sockratease
|
|
« Reply #1 on: July 23, 2007, 10:14:25 AM » |
|
I Like It!!
Can you do Cows?
|
|
|
|
|
Logged
|
Life is complex - It has real and imaginary components. The All New Fractal Forums is now in Public Beta Testing! Visit FractalForums.org and check it out! |
|
|
|
Kimmo
Guest
|
|
« Reply #2 on: October 17, 2007, 11:14:06 PM » |
|
This is a Mandelbrot plot using escape count coloring for the neighborhoods of the set. The colors are assigned using a histogram of the distribution of iteration values in the plot. The color change is small for iteration values with a small number of pixels, and the color change is large when there are a lot of pixels with that iteration value. This approach to color tables tends to create plots where the structure is easily visible, without a lot of visual "noise" from areas where the iteration value changes rapidly. The result is similar to using exponential color tables, but histogram-based color tables adapt automatically to the distribution of iteration values in the plot.
The plot was generated using FractalWorks, a program I am developing for Macintosh computers. Is there any way I can employ this colouring method on a PC? |
|
|
|
|
Logged
|
|
|
|
|
Duncan C
|
|
« Reply #3 on: November 09, 2007, 11:15:15 PM » |
|
This is a Mandelbrot plot using escape count coloring for the neighborhoods of the set. The colors are assigned using a histogram of the distribution of iteration values in the plot. The color change is small for iteration values with a small number of pixels, and the color change is large when there are a lot of pixels with that iteration value. This approach to color tables tends to create plots where the structure is easily visible, without a lot of visual "noise" from areas where the iteration value changes rapidly. The result is similar to using exponential color tables, but histogram-based color tables adapt automatically to the distribution of iteration values in the plot.
The plot was generated using FractalWorks, a program I am developing for Macintosh computers. Is there any way I can employ this colouring method on a PC? Kimmo, Sorry, I haven't been on these boards for a while. I've missed a couple of your posts. Melinda Green, the inventor of the Buddahbrot, apparently came up with a histogram-based color scheme on her own. I think she did her work on Windows. She also had a custom version of XAOS developed that used histogram-based color tables. Unfortunately that custom code was written against an older version of the XAOS code-base. She asked me if I would be willing to teach the new, open source, cross-platform version of XAOS to use histogram based color tables, but I haven't had the time to do so. If you're a software developer it's not that difficult to implement histogram based color tables. I'd be happy to give you some guidance. Duncan C |
|
|
|
|
Logged
|
Regards,
Duncan C
|
|
|
|
this is not kasker
Guest
|
|
« Reply #4 on: November 10, 2007, 01:10:37 AM » |
|
Heh, this is cool. I always enjoy fractals that look like something from real life. And good explanation too, always helps to know how other people go about making their fractals.
|
|
|
|
|
Logged
|
|
|
|
|
Kimmo
Guest
|
|
« Reply #5 on: November 13, 2007, 06:47:02 PM » |
|
If you're a software developer it's not that difficult to implement histogram based color tables. I'd be happy to give you some guidance. Unfortunately, I have chronic stamina issues when it comes to achievement, so it's pretty likely I'll only ever speak one language... : / Guess I'll just have to wait for enough folks to get interested in fractals to create the demand for the comprehensive app I hanker for... |
|
|
|
|
Logged
|
|
|
|
|
Duncan C
|
|
« Reply #6 on: November 16, 2007, 01:59:20 AM » |
|
If you're a software developer it's not that difficult to implement histogram based color tables. I'd be happy to give you some guidance. Unfortunately, I have chronic stamina issues when it comes to achievement, so it's pretty likely I'll only ever speak one language... : / Guess I'll just have to wait for enough folks to get interested in fractals to create the demand for the comprehensive app I hanker for... Kimmo, From what I hear, UltraFractal is what you need. It sounds like it's the all-singing, all-dancing fractal renderer. I'm a Mac user, so I haven't tried it out, but it sounds quite comprehensive. Duncan C |
|
|
|
|
Logged
|
Regards,
Duncan C
|
|
|
|
Kimmo
Guest
|
|
« Reply #7 on: November 21, 2007, 01:56:23 AM » |
|
It's okay, but I'd like something about 20 versions more featured and refined. Aside from higher colour depth, it doesn't seem any more powerful than Fractint. Less so, in some ways.
Pretty disappointing, really.
|
|
|
|
|
Logged
|
|
|
|
|
twinbee
|
|
« Reply #8 on: November 22, 2007, 08:10:52 PM » |
|
I spy a mandelbug. I don't mind the sheep, but we MUST get rid of all the mandelbug viruses before they destroy us all! They always find a way to insidiously creep into our fractal designs, especially the so-called Mandelbrot one. There are an infinite amount of bugs, and only a finite number of us - you do the math! Nice pic by the way  |
|
|
|
« Last Edit: November 22, 2007, 08:14:08 PM by twinbee »
|
Logged
|
|
|
|
|
lycium
|
|
« Reply #9 on: November 23, 2007, 03:47:55 AM » |
|
we can expect to see the mandelbrot set in a lot of places because it is universal. |
|
|
|
|
Logged
|
|
|
|
|
this is not kasker
Guest
|
|
« Reply #10 on: November 23, 2007, 07:01:12 PM » |
|
I think UF is a great app. I'm able to create completely dynamic fractal formulas that can be changed on a whim(mostly by creating variables and functions that can be changed through the gui). And the same with color algorithms though I don't have a good understanding of how they work. For me fractint doesn't cut it.
|
|
|
|
|
Logged
|
|
|
|
|
gandreas
|
|
« Reply #11 on: November 23, 2007, 08:05:40 PM » |
|
we can expect to see the mandelbrot set in a lot of places because it is universal. Which is probably one of the reasons that I for one wouldn't mind seeing a bit less of it. At least Sierpinski triangles are aesthetically pleasing... |
|
|
|
|
Logged
|
|
|
|
|


