Logo by Trifox - Contribute your own Logo!

END OF AN ERA, FRACTALFORUMS.COM IS CONTINUED ON FRACTALFORUMS.ORG

it was a great time but no longer maintainable by c.Kleinhuis contact him for any data retrieval,
thanks and see you perhaps in 10 years again

this forum will stay online for reference
News: Visit us on facebook
 
*
Welcome, Guest. Please login or register. April 19, 2024, 05:29:39 PM


Login with username, password and session length


The All New FractalForums is now in Public Beta Testing! Visit FractalForums.org and check it out!


Pages: [1]   Go Down
  Print  
Share this topic on DiggShare this topic on FacebookShare this topic on GoogleShare this topic on RedditShare this topic on StumbleUponShare this topic on Twitter
Author Topic: 2D Mandelbox: Parameter Visualization  (Read 2623 times)
0 Members and 1 Guest are viewing this topic.
CozyG
Forums Freshman
**
Posts: 13


« on: August 01, 2017, 12:11:16 PM »

I've been trying some ideas out using a 2D Mandelbox, for example in this thread about shape inversions. In the course of that work/play I've implemented a 2D Mandelbox in Fragmentarium that includes an overlay to visualize some of the parameters and behavior. It has become a valuable diagnostic and learning tool for me, so I thought I'd post the code on its own. Here's an image showing what it can do:


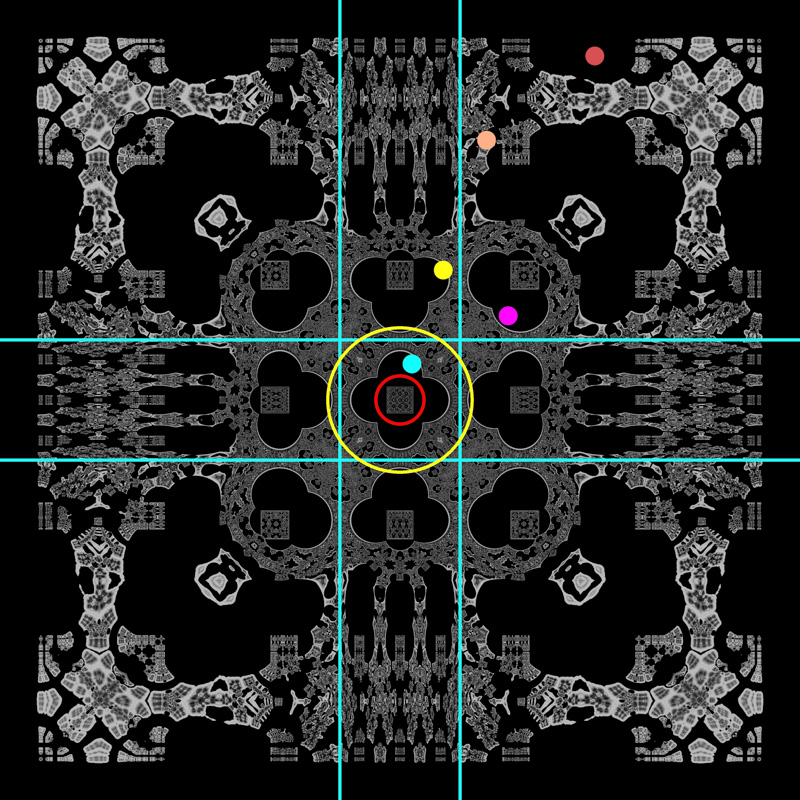
This version of the 2D Mandelbox can show parameters in an overlay for the position of the boxfold (as light blue lines), the inversion radius (yellow circle outline), and the inversion minimum radius (red circle outline). The centers of the boxfold and the inversion are also modifiable parameters. The escape-time rendering can be toggled to grayscale and faded, to help highlight the parameter overlay.

The overlay can also show the orbit of a specified point within a single Mandelbox iteration.
Mandelbox iteration: p' = scale*spherefold(boxfold(p)) + offset

The transformed point is shown as small solid circles, for each step within the iteration:
     initial position => bright pink
     position after boxfold => light blue
     position after spherefold => yellow
     position after scaling => light orange
     position after offset => dark orange
This makes for educational animations if you smoothly change the initial position of the point smiley

I am using this Mandelbox2D_ParamViz as a base for experiments, which makes it straightforward to add additional params to the overlay visualization. Frag files are attached.


* Mandelbox2D_ParamViz.zip (5.72 KB - downloaded 223 times.)
« Last Edit: August 01, 2017, 12:17:17 PM by CozyG » Logged
Pages: [1]   Go Down
  Print  
 
Jump to:  

Related Topics
Subject Started by Replies Views Last post
Help with Parameter files. General Discussion Max 5 2153 Last post October 20, 2006, 11:40:59 PM
by alan2here
FE Parameter Files Parameter Files 011art 0 8569 Last post November 16, 2006, 04:02:15 AM
by 011art
FMF Parameter Files Parameter Files spanzhang 3 8883 Last post June 01, 2007, 08:46:51 AM
by Nahee_Enterprises
IFrIT - Visualization tool 3D Fractal Generation this is not kasker 0 1966 Last post November 20, 2007, 01:49:18 AM
by this is not kasker
neural net visualization General Discussion marius 4 4768 Last post June 19, 2015, 03:45:36 AM
by 3dickulus

Powered by MySQL Powered by PHP Powered by SMF 1.1.21 | SMF © 2015, Simple Machines

Valid XHTML 1.0! Valid CSS! Dilber MC Theme by HarzeM
Page created in 0.163 seconds with 25 queries. (Pretty URLs adds 0.006s, 2q)